Standard
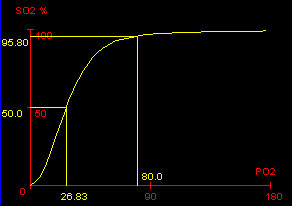
Oxyhemoglobin Dissociation Curve showing the P50, and the SaO2 at PaO2
= 80 mmHg.
The Interactive Oxyhemoglobin Dissociation Curve
Nielufar
Varjavand, MD
Department of
Medicine
Medical College of Pennsylvania, East Falls
Jonathan M. Kaye, PhD
Shaojie Wang, MSE
Frank P. Primiano, Jr., PhD
Amethyst Research,
LLC
June 1, 2000
CONTENTS
Background
Understanding the Dissociation Curve
Factors that Affect the Standard Dissociation Curve
Some Clinical Uses of the Dissociation Curve
The Implemented Model
Bibliography
The oxyhemoglobin dissociation curve is an important tool for understanding how our blood carries and releases oxygen. Specifically, the oxyhemoglobin dissociation curve relates oxygen saturation (SO2) and partial pressure of oxygen in the blood (PO2), and is determined by what is called "hemoglobin's affinity for oxygen," that is, how readily hemoglobin acquires and releases oxygen molecules from its surrounding tissue.
Hemoglobin (Hb), an intracellular protein, is the primary vehicle for transporting oxygen in the blood. Oxygen is also carried (dissolved) in plasma, but to a much lesser degree. Hemoglobin is contained in erythrocytes, more commonly referred to as red blood cells.
Under certain conditions, oxygen bound to the hemoglobin is released into the body tissue, and under others, it is absorbed from the tissue into the blood. Each hemoglobin molecule has a limited capacity for holding oxygen molecules. How much of that capacity that is filled by oxygen bound to the hemoglobin at any time is called the oxygen saturation. Expressed as a percentage, the oxygen saturation is the ratio of the amount of oxygen bound to the hemoglobin, to the oxygen carrying capacity of the hemoglobin. The oxygen carrying capacity is determined by the amount of hemoglobin present in the blood.
The amount of oxygen bound to the hemoglobin at any time is related, in large part, to the partial pressure of oxygen to which the hemoglobin is exposed. In the lungs, at the alveolar-capillary interface, the partial pressure of oxygen is typically high, and therefore the oxygen binds readily to hemoglobin that is present. As the blood circulates to other body tissue in which the partial pressure of oxygen is less, the hemoglobin releases the oxygen into the tissue because the hemoglobin cannot maintain its full bound capacity of oxygen in the presence of lower oxygen partial pressures.
Understanding the Dissociation Curve
In its basic form, the oxyhemoglobin dissociation curve describes the relation between the partial pressure of oxygen (x axis) and the oxygen saturation (y axis). Hemoglobin's affinity for oxygen increases as successive molecules of oxygen bind. More molecules bind as the oxygen partial pressure increases until the maximum amount that can be bound is reached. As this limit is approached, very little additional binding occurs and the curve levels out as the hemoglobin becomes saturated with oxygen. Hence the curve has a sigmoidal or S-shape. At pressures above about 60 mmHg, the standard dissociation curve is relatively flat, which means that the oxygen content of the blood does not change significantly even with large increases in the oxygen partial pressure. To get more oxygen to the tissue would require blood transfusions to increase the hemoglobin count (and hence the oxygen carrying capacity), or supplemental oxygen that would increase the oxygen dissolved in plasma.
|
Standard
Oxyhemoglobin Dissociation Curve showing the P50, and the SaO2 at PaO2
= 80 mmHg.
|
Although binding of oxygen to hemoglobin continues to some extent for pressures below about 60 mmHg, as oxygen partial pressures decrease in this steep area of the curve, the oxygen is unloaded to peripheral tissue readily as the hemoglobin's affinity diminishes.
The partial pressure of oxygen in the blood at which the hemoglobin is 50% saturated, typically about 26.6 mmHg for a healthy person, is known as the P50. The P50 is a conventional measure of hemoglobin affinity for oxygen. In the presence of disease or other conditions that change the hemoglobin's oxygen affinity and, consequently, shift the curve to the right or left, the P50 changes accordingly. An increased P50 indicates a rightward shift of the standard curve, which means that a larger partial pressure is necessary to maintain a 50% oxygen saturation. This indicates a decreased affinity. Conversely, a lower P50 indicates a leftward shift and a higher affinity.
Factors that Affect the Standard Dissociation Curve
The effectiveness of hemoglobin-oxygen binding can be affected by several factors. The factors can be viewed as having the effect of shifting or reshaping the oxyhemoglobin curve ("the standard curve") of a typical, healthy person. The standard curve is shifted to the right by an increase in temperature, 2,3-DPG, or PCO2, or a decrease in pH. The curve is shifted to the left by the opposite of these conditions. A rightward shift, by definition, causes a decrease in the affinity of hemoglobin for oxygen. This makes it harder for the hemoglobin to bind to oxygen (requiring a higher partial pressure to achieve the same oxygen saturation), but it makes it easier for the hemoglobin to release bound oxygen. Conversely, a leftward shift increases the affinity, making the oxygen easier for the hemoglobin to pick up but harder to release.
We list several of the factors here and indicate how the curve is affected:
Some Clinical Uses of the Dissociation Curve
The oxyhemoglobin dissociation curve, and the role of hemoglobin, are important clinically in understanding the relationship of arterial, oxygen saturation to the partial pressure of oxygen in arterial blood, particularly as it relates to disease. For example, it is useful to observe in healthy patients that the slope of the curve increases significantly from the mid-sixties (PaO2) downward, which indicates to the health professional that decreases in PaO2 in this region will have dramatic effects on arterial oxygen saturation.
Also, it is useful to have a good grasp on the influence of factors that can affect the curve or the affinity of hemoglobin to oxygen. For example, it is useful to remember the powerful effects of carbon monoxide in trying to explain hypoxemia in the presence of a normal PaO2 and SaO2.
Understanding the elements of the dissociation curve, such as the basis of oxygen saturation, can also help explain clinical problems. For example, the differential diagnosis of a patient that presents with shortness of breath in the presence of adequate ventilation and SaO2 should include hemoglobin deficiency, because routine SaO2 calculations are based on normal hemoglobin values.
The Implemented Model (Shaojie Wang)
The implementation in the accompanying Java program is based on the classic oxyhemoglobin dissociation curve equation developed by Kelman [3] and from data obtained by Severinghaus [4]. The operator enters either an oxygen tension (PO2) or an oxygen saturation (SO2), then presses CALCULATE to determine the unknown variable.
Kelman's equation allows the dissociation curve to be adjusted by pH, PCO2, and T (temperature), but not by 2,3-DPG or other factors known to affect the curve.
Details. Kelman first gives an equation for the standard dissociation curve (pH=7.4, PCO2=40 mmHg, and Temp=37C), that relates the oxygen saturation (SpO2) and the oxygen tension, PO2 (x):
SpO2 = 100 (a1 x + a2 x^2 + a3 x^3 + x^4) / (a4 + a5 x + a6 x^2 + a7 x^3 + x^4).
This form is purely empirical and is not meant to imply any physiological significance. The seven coefficients (a1-a7) were determined by a least-squares fitting of the equation to Severinghaus' 38 paired values of oxygen tension (x) and saturation (SO2). The coefficients are:
a1 = -8.5322289 * 10^3
a2 = 2.1214010 * 10^3
a3 = -6.7073989 * 10^1
a4 = 9.3596087 * 10^5
a5 = -3.1346258 * 10^4
a6 = 2.3961674 * 10^3
a7 = -6.7104406 * 10^1
Kelman's strategy in predicting oxygen saturation is to take the actual oxygen tension, PO2, measured at actual conditions of pH, PaCO2, and T, convert it to an oxygen tension that would be obtained at a pH of 7.40, a PaCO2 of 40 mmHg, and a temperature of 37 C, then use his standard dissociation curve equation to predict oxygen saturation. The equation Kelman developed to convert the actual oxygen tension to this 'virtual' oxygen tension is
[PO2 virtual] = [PaO2 actual] * 10^(0.024(37 - T) + 0.40(pH - 7.40) + 0.06(log10(40) - log10(PaCO2)))
here is all the MatLab code (thanks to M. Pekar for verification):
T = 37;
pH = 7.4;
PaO2 = 84;
PaCO2 = 40;
x = PaO2 * 10^(0.024 * (37 - T) + 0.40*(pH - 7.40) + 0.06*(log10(40) - log10(PaCO2)));a1 = -8.5322289 * 10^3
a2 = 2.1214010 * 10^3
a3 = -6.7073989 * 10^1
a4 = 9.3596087 * 10^5
a5 = -3.1346258 * 10^4
a6 = 2.3961674 * 10^3
a7 = -6.7104406 * 10^1SpO2 = 100*(a1*x + a2*x^2 + a3*x^3 + x^4) / (a4 + a5*x + a6*x^2 + a7*x^3 + x^4);
We found that the curve fit Severinghaus' data [4] well for oxygen tensions below about 100 mmHg, but above that, the accuracy greatly diminishes. However, patients on supplemental oxygen may have oxygen tensions greater than 100 mmHg. Therefore, we corrected the curve for oxygen tensions above 100 by fitting data from Severinghaus [4] up to 700 mmHg using the Lagrangian interpolation method, an approach widely used for obtaining an exact fit to a given data set.
1. Ganong, WF, Review of Medical
Physiology, 16th Edition, Appleton & Lange, Norwalk, CT, 1993.
2. Grippi, MA, Pulmonary Pathophysiology, JB Lippincott Company, Philadelphia,
1995.
3. Kelman, GR, Digital computer subroutine for the conversion of oxygen tension
into saturation. J Appl Physiol. 21(4): 1375-1376. 1966.
4. Severinghaus, JW, Simple, accurate equations for human blood O2 dissociation
computations. J Appl. Physiol.: Respir. Environ. Exercise Physiol. 46(3):
599-602, 1979.